We wanted to thank you both for helping us to become homeowners in this incredible sellers’ market. We could not have done it without your expertise in the Berkeley area and your in-depth knowledge of the local realtor community. We really appreciated your internet empowered way of doing business to keep us informed. Your weekly ratings on open homes greatly shortened our trips through town.
Heidi Rosenfelder and David Greenbaum
I bought my first building in 1977 … and still have it! Having personally bought or sold over a dozen properties in sellers’, buyers’, and balanced markets, we have the knowledge and experience to represent you well too.
Graphs and charts are a great way to give you a quick market overview; we bring our 40+ years of experience to bear when analyzing the market and advising you.
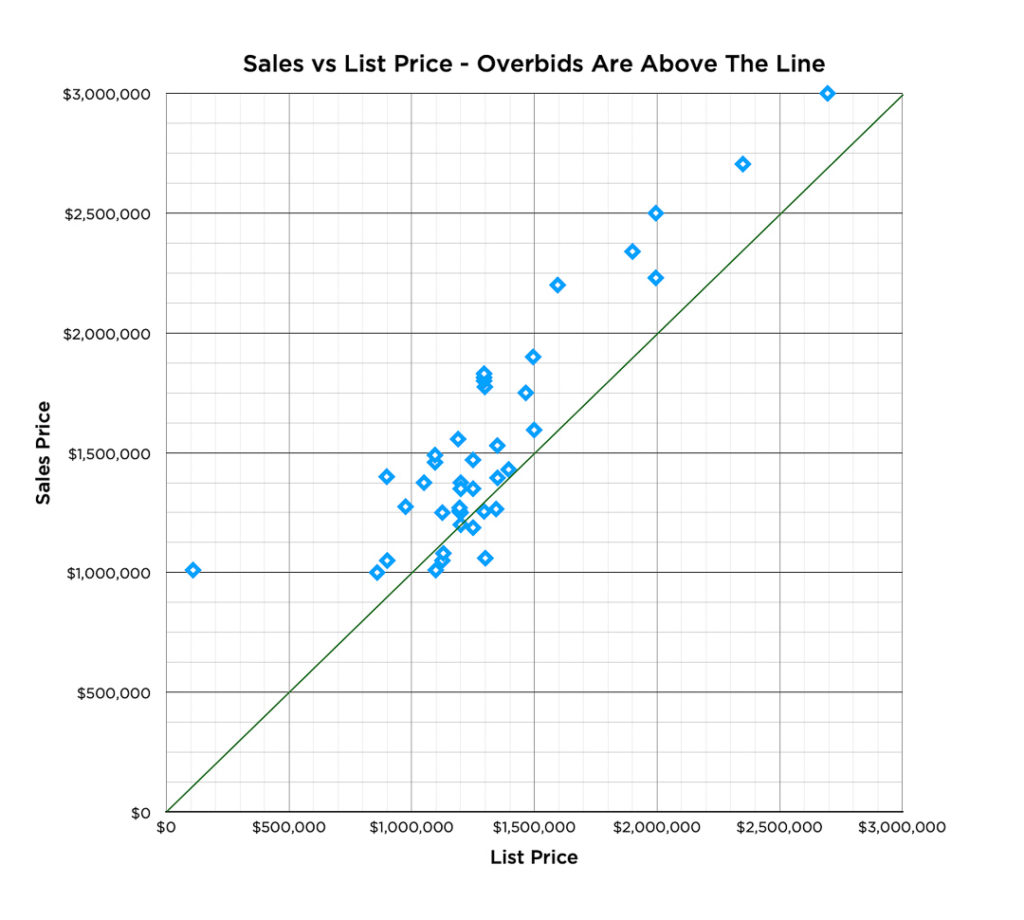
We’ve been in a seller’s market for many years. With low inventory, other buyers will likely be interested in the same home as you. Well-priced homes receive multiple offers and sell for more than the asking price. That’s where our research and analysis give you the extra edge.
The green line represents a sales price equal to the list price.
I created this graph give a buyer a snapshot of neighborhood market conditions. It shows a strong sellers’ market, where most of the homes sold above the list price (above the line). Most of the homes in this neighborhood were listed between $1,000,000 and $1,500,000; they sold for $1,000,000 to $1,800,00.
A realtor once told me “I can’t imagine being an engineer in real estate” I smiled and said, “I can’t imagine not!”
Market Research
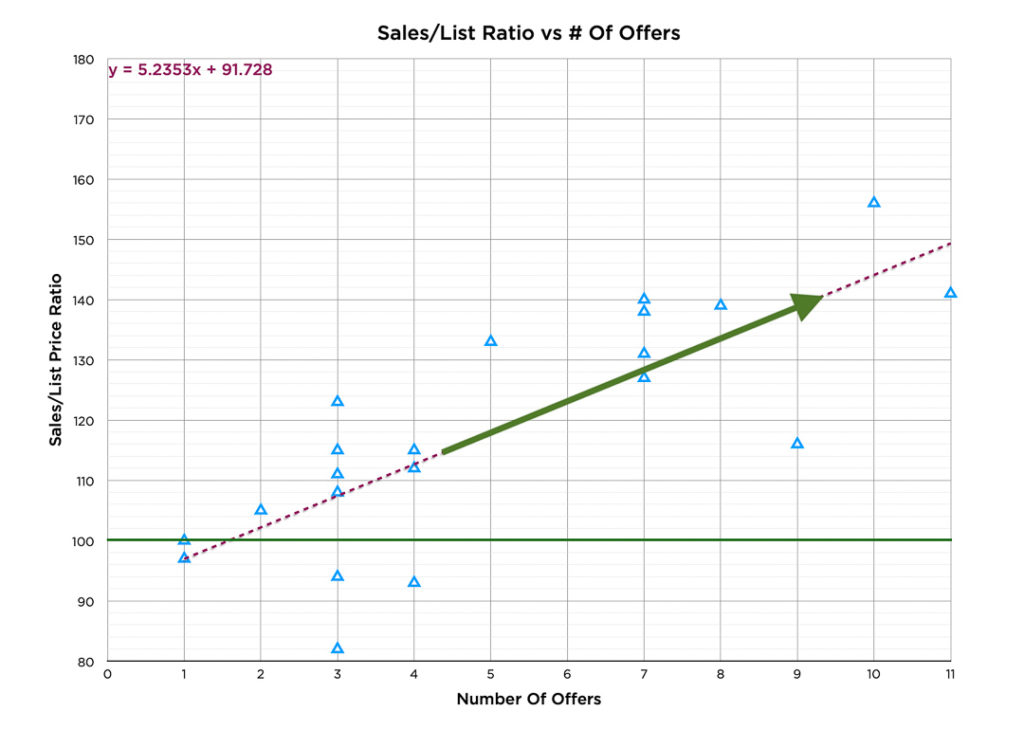
There’s a relationship between how many buyers ask for property disclosures, and how many offers the home receives.
There is also a correlation between how many offers a listing receives, and the amount of overbid.
Relocating From Elsewhere?
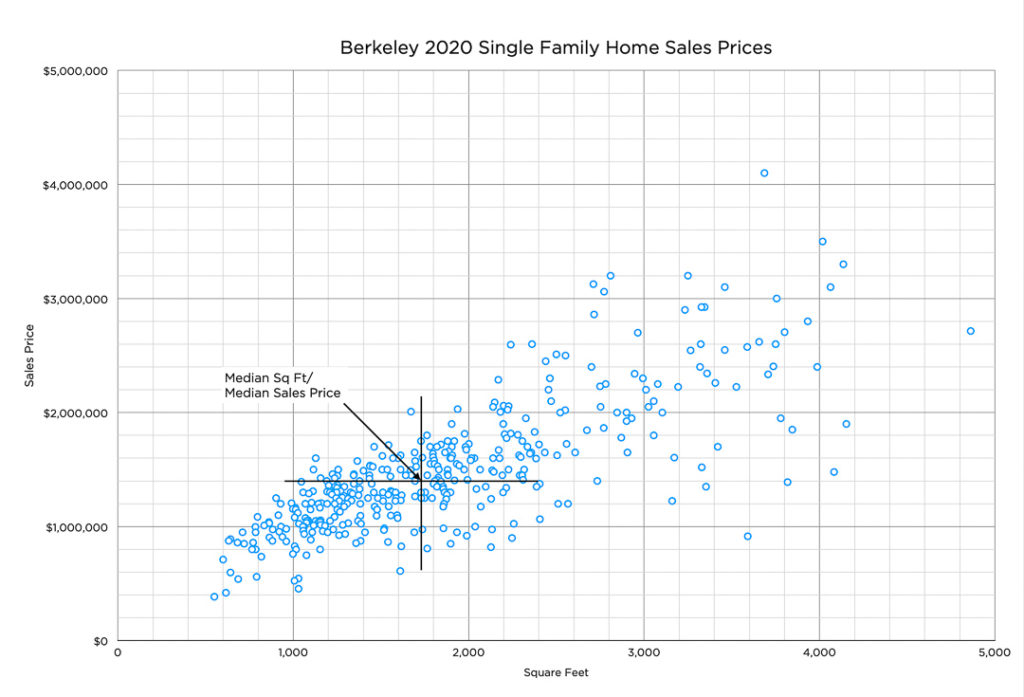
Many of Berkeley’s homes were built in the 20’s, so they’re not as large as homes you’ll find in other states.
This graph gives a quick overview of Berkeley 2020 single-family home sales prices … and show you the range of sales prices for different home sizes.
In 2020, the median home was about 1,700 sq ft, and the median sales price was $1,400.000.
Detailed Analysis For Each Home You’re Considering Buying
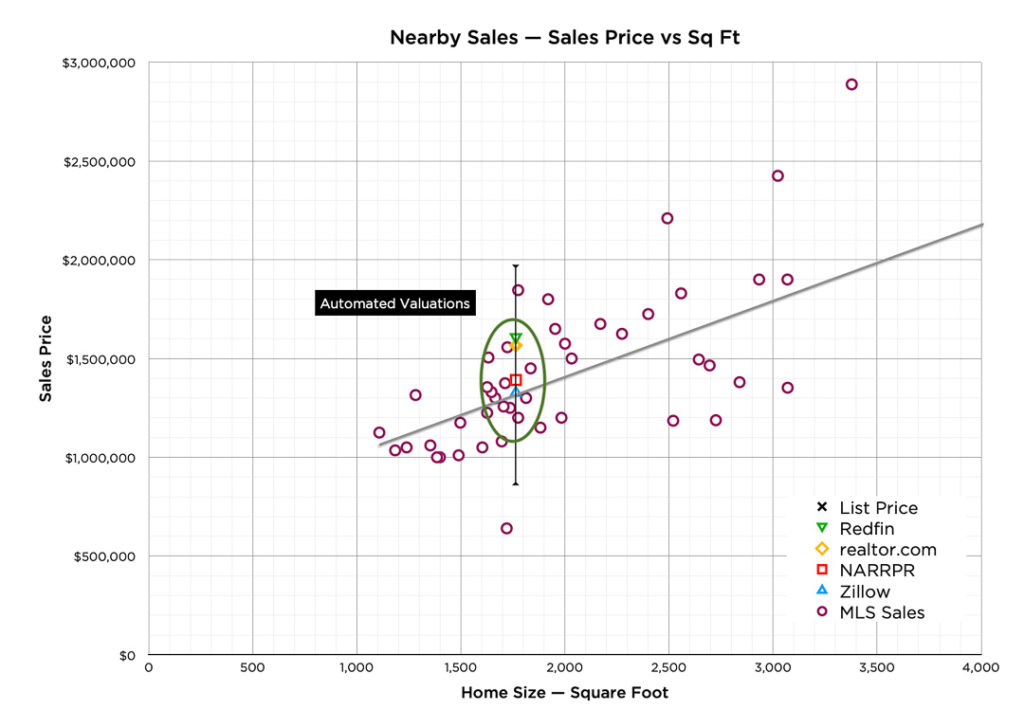
There’s a strong relationship between the square footage of a home and the sales price. Homes are in different conditions, so you’d expect there to be scattered data, but the trend line is clear.
What about Zillow? We’ll compare actual MLS sales prices to the values assigned by automated valuation websites such as Zillow, Redfin, Realtor.com, and NARRPR. The circles are sales reported in the Multiple Listing Service (MLS). The triangles, diamonds and squares are automated valuations.
We offer the advantage of having been inside many of the homes … so we have “boots on the ground” knowledge that computer algorithms can’t possibly have.
Well Priced Homes Sell Quickly … And With Large Overbids
Most homes sell within 10-15 days of coming on the market – that’s when a home is highly likely to sell for more than its asking price. Once a home has been on the market for about a month, it often sells for less than the original asking price. Savvy sellers position their home’s list price to generate multiple offers.
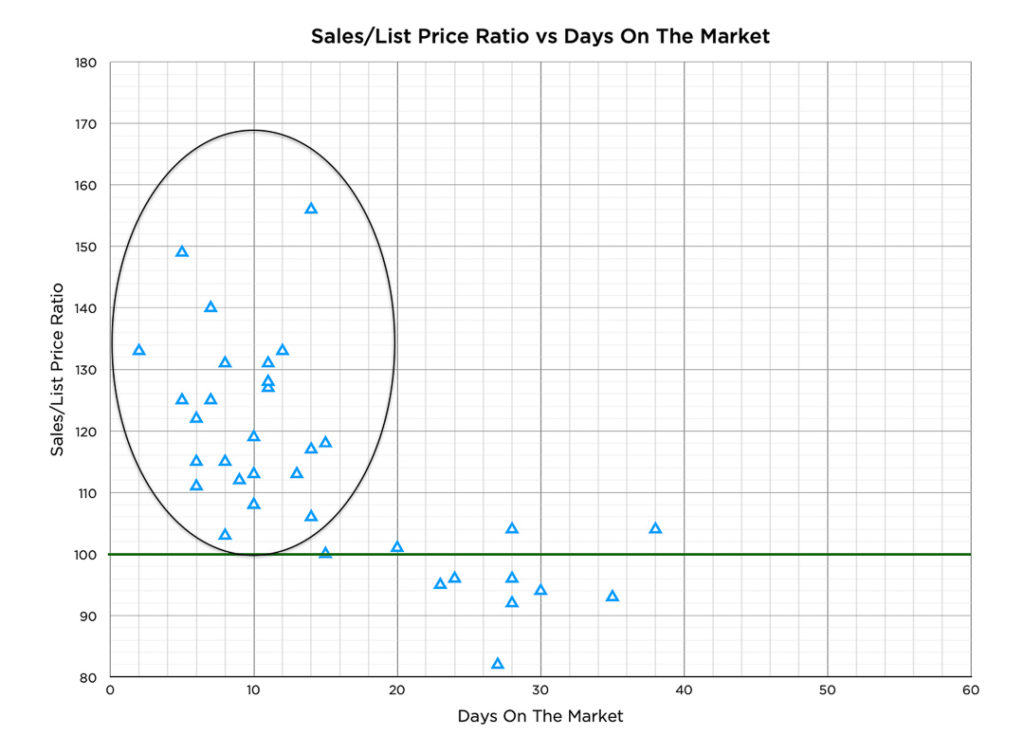
The market’s always changing – you’ll have up-to-date information when you’re ready to make your offer.
#Serkes #RealEstate #Market #Data #Research #Analysis #Berkeley #AdvocateOnYourSide